


The main steps for choosing a metric
It should be noted that the metric that we optimize and the metric by which we determine the quality of the model are, as a rule, different. Below we will consider the metrics that we can optimize in one form or another directly in the model. Initial business metrics can be taken as the metrics that we use to evaluate the performance of the model.
Understanding the business challenge
From the initial premises, it is necessary to highlight what type of problem we are solving. The main types of tasks:
- Classification. Your algorithm will predict the data type from the given set. For example saying yes / no / not sure.
- Regression. The algorithm will predict any numbers. For example, tomorrow’s temperature.
- Ranging. The model will predict the order of the elements. For example, we were given a classroom and we must rank the students by height, that is, order them from highest to lowest.
We are solving the problem of finding a mathematical metric that will also optimize the original business problem. Below are some basic metrics to start with.
Classification
Confusion Matrix
It is presented in the form of a table, which is used to describe the accuracy of the classifier.

Some examples:
False Positive (FP) classifies a good email as spam when it detects spam.
False Negative (FN) medical testing can falsely report disease absent when present.

Accuracy Metric
This metric can be called basic. It measures the number of correctly classified objects relative to the total number of all objects.
Keep in mind that accuracy has some disadvantages: it is not ideal for unbalanced classes, where there may be many instances of one class and few others.

Recall / Sensitivity Metric
How many objects our model was able to correctly classify with a positive label from the whole set of positive ones.

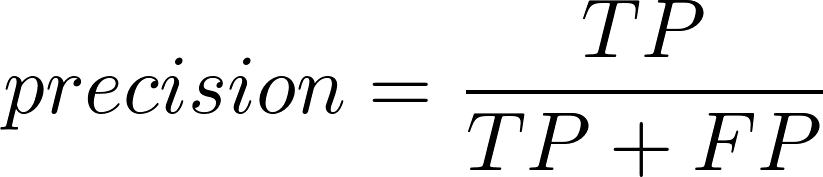
Precision Metric
How many of all objects that are classified as positive are actually positive, relative to the total number of positive labels received from the model.
F1 score
The combination of precision and recall provides some compromise between the two, the F1 score reaches its best value at 1 and the worst at 0.

Regression
Mean Absolute Error (MAE)
The metric measures the average sum of the absolute difference between the actual value and the predicted value.

Mean Squared Error (MSE)
Measures the average sum of the square of the difference between the actual value and the predicted value for all data points. Raising to the second power is performed, so negative values are not compensated for with positive ones. And also, due to the properties of this metric, the influence of errors increases, by quadrature from the original value. This means that if in the original measurements we were mistaken by 1, then the metric will show 1, 2-4, 3-9 and so on. The lower the MSE, the more accurate our prediction is. The optimum is reached at point 0, that is, we predict perfectly.
Compared to the average absolute error, MSE has several advantages:
It emphasizes large errors over smaller errors.
It is differentiable, which allows it to be more efficiently used to find the minimum or maximum values using mathematical methods.

Root Mean Squared Error (RMSE)
This is the root of the square of the error. It is easy to interpret since it has the same units as the original values (as opposed to MSE). It also operates with smaller values in absolute value, which can be useful for computing on a computer.

Ranging
Simple metric
Best Predicted vs Human (BPH):
Take the highest relevance item from the algorithm ranked, then compare it to the human score. This metric returns a binary vector of coincidence or non-coincidence of the evaluation of the algorithm in comparison with the human.
Kendall’s tau
Measures the correlation between two lists of ranked items by counting matched and inconsistent pairwise comparisons: two rank scores (machine prediction and human prediction) are given for each instance. First, they are decomposed into paired comparisons – the sign of the relationship between the current rank and the rest is considered. A matched pair is a situation when the comparison sign corresponds to the corresponding pairwise comparison with a human annotation. Otherwise, the result is counted as an unmatched pair. Therefore, tau is calculated by the formula

With values from minus one to one. The closer | τ | values to one, the better the rating. In particular, when values approach minus one, the rating is just as good, but the order of its elements should be taken in reverse order. This is typical of scoring scores that assign higher scores to the best translations, while people’s scores tend to assign lower ranks to the best. A value of zero indicates no correlation.
Links to additional materials:
- https://ufal.mff.cuni.cz/pbml/100/art-avramidis.pdf
- https://machinelearningmastery.com/metrics-evaluate-machine-learning-algorithms-python/
- https://www.quora.com/How-do-I-choose-error-metrics-for-machine-learning-algorithm
- https://www.analyticsvidhya.com/blog/2016/02/7-important-model-evaluation-error-metrics/


